
Do you ever ponder what your connected devices are up to? With an average of 10 devices per broadband home, you might question:
- When is Alexa listening in?
- How much data does my Xbox One consume?
- How would I know if a home device is hacked?
You're in luck. The Minim platform has a growing database of consumer Internet of Things (IoT) insights. Through AI-driven analysis, Minim knows when a device is acting suspiciously— like when we discovered our CEO's smart yard sprinkler was reporting to a foreign entity. Keep reading for a peek inside Minim's IoT database.
How Minim works
When a device is behaving suspiciously, Minim's applications alert users with suggestions. This might be simply a suggestion to improve the device's WiFi signal, or an alert of a real security threat that Minim has blocked. But, how do we know when a device is behaving out of its norm?
Minim employs proprietary fingerprinting technology to identify and monitor connected devices in customer homes. By observing multiple devices of the same kind, say an Amazon Echo, our platform develops an understanding of what they normally do: how much data they consume, with which entities they communicate, at what time(s) of day they typically communicate.
To illustrate how Minim develops device behavioral models, we've created a walkthrough analysis of two attributes for popular devices: data consumption and DNS communication.
Real-world consumer IoT data
For this analysis, we've selected six devices, each from a category in our IoT database:
- Xbox One (Gaming/Entertainment)
- Philips Hue (Lighting/Electrical)
- Nest Camera (Surveillance/Monitoring)
- iPhone X (Mobile)
- Chromecast (Streaming/OTT)
- Amazon Echo (Speaker/Assistant)
The data was collected from October 4, 2019 to October 22, 2019, across a sample of hundreds of home networks in the U.S. and taking into account time zone. None of the devices in this sample suffered from a security issue, so the following insights represent what we believe to be normal device behavior.
Xbox One data usage
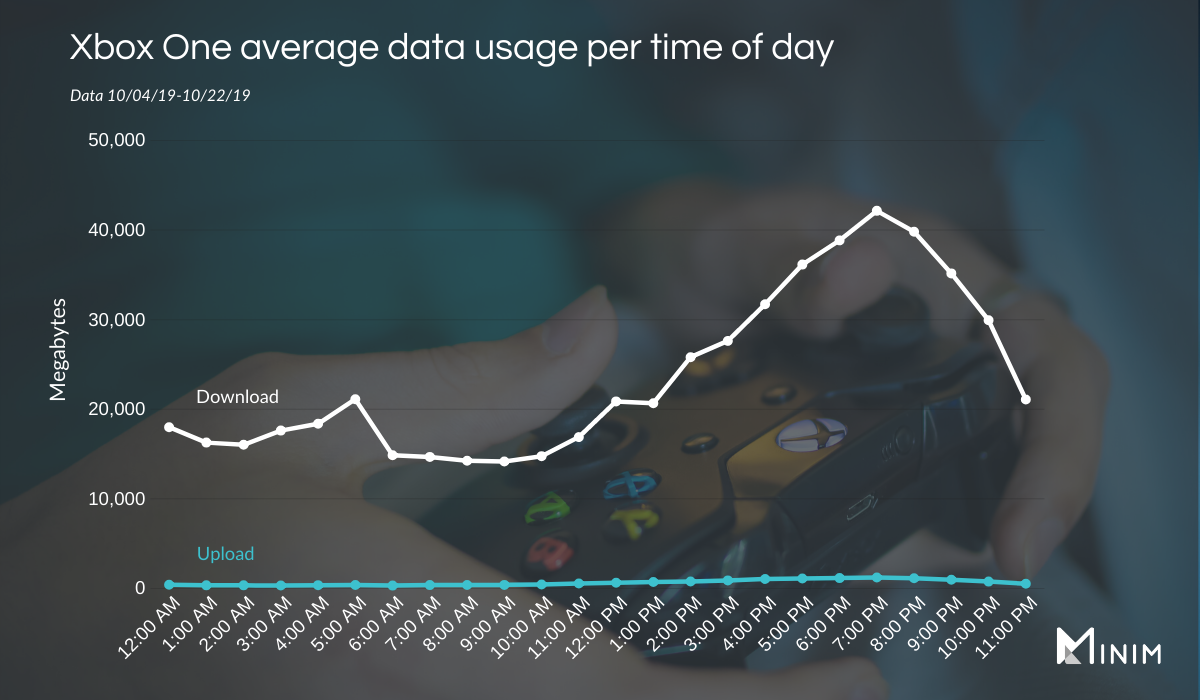
Above, we have average data usage by Xbox One by time of day. As we can see, Xbox One is heavy on downloaded data versus upload. The download data ramps up after school and work hours to a peak above 40 MB between 7:00 to 8:00 pm, high-time for household entertainment.
Unsurprisingly, Xbox One trends higher than most devices in data consumption, as we'll see below. Network middleware company SoftatHome recently reported at Broadband World Forum that 60% of global internet traffic is video streaming, driven by digital distribution (some downloads are 100 GB+) and streaming with Twitch and YouTube.
Another interesting attribute of the Xbox One is that data usage does not trend at zero at any given hour. Instead of jumping to conclusions on skipped work or school, this might be explained by the Xbox One modes. In Instant-On mode, the device is "off" but listening for you to say its wake word. In Energy-Saving mode, the device is actually off and needs the power button pressed to turn on. Since the Xbox One's data usage never reaches zero, we can assume most players keep their device on Instant-On mode.
Nest Camera data usage
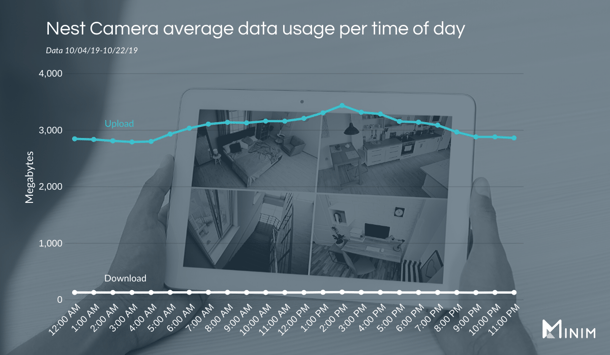
The Nest Camera brings a nice contrast to the Xbox One. It's heavy on upload data, with an average of 3,055 MB uploaded in an hour, consistently video streaming the home to the Nest cloud. There's a slight increase in upload data during waking hours, which might correlate to night vs. daytime video stream modes.
Through the Nest camera's contrast with the Xbox One, we can start to see how data consumption pattern is a signature attribute for devices. Furthermore, if the Nest Camera's usage were to suddenly drop versus its norm, Minim signals to the end user that there's an issue. For example, perhaps the camera was moved out of optimal WiFi range. Our WiFi signal strength indicator helps Minim mobile app users identify and solve such performance issues.
Philips Hue data usage
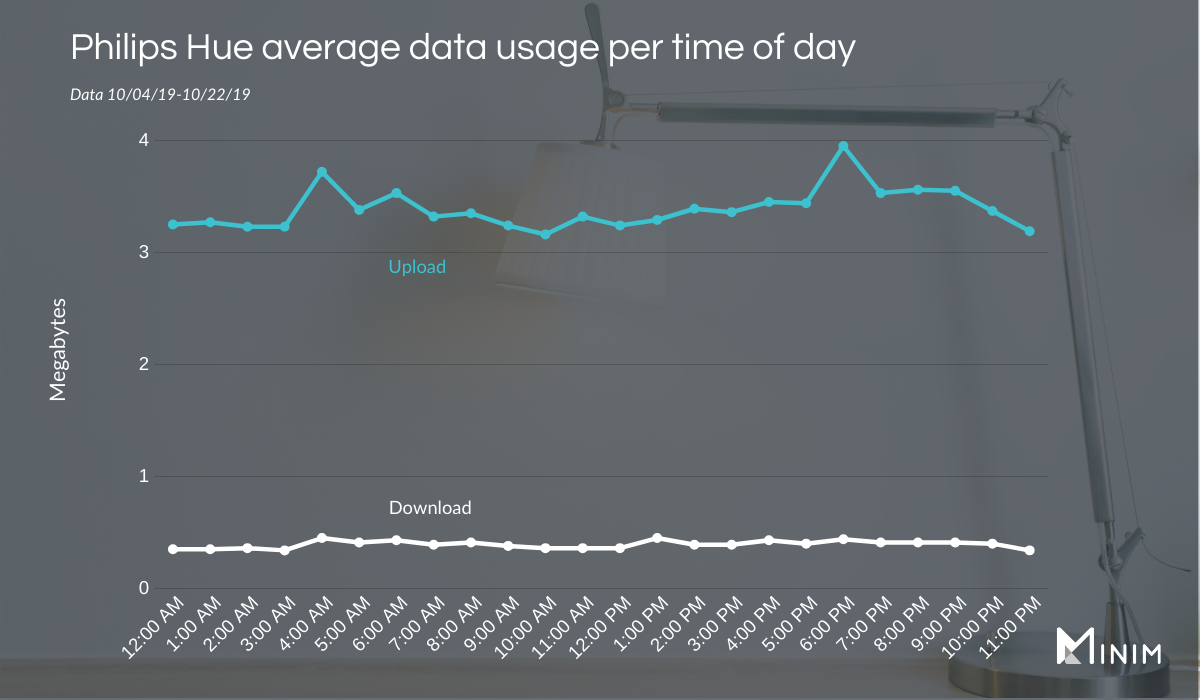
Much like the Nest Camera, the Philips Hue uploads more data than it downloads and has consistent data usage throughout the day. However, as expected, this device uses very little data, with an average upload of 3.4 MB per hour and download of 0.4 MB per hour. This pattern makes it very easy to see cyber attacks that result in abnormal data usage spikes— as was the case in this smart light bulb's story.
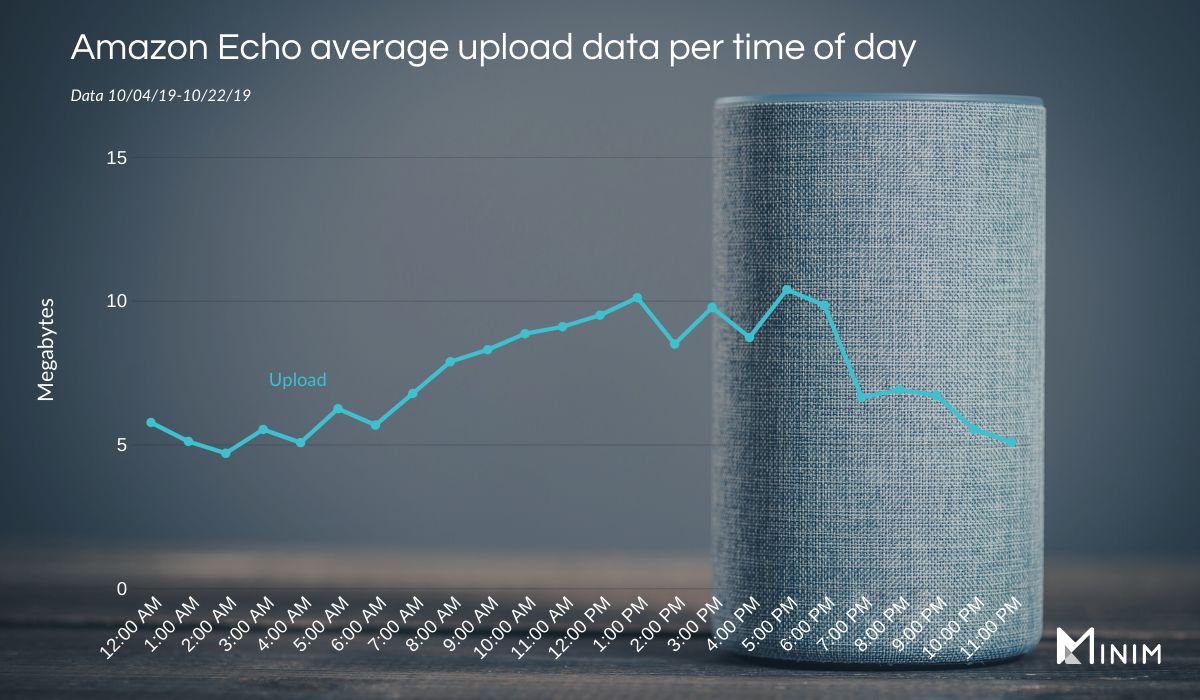
Amazon Echo data usage
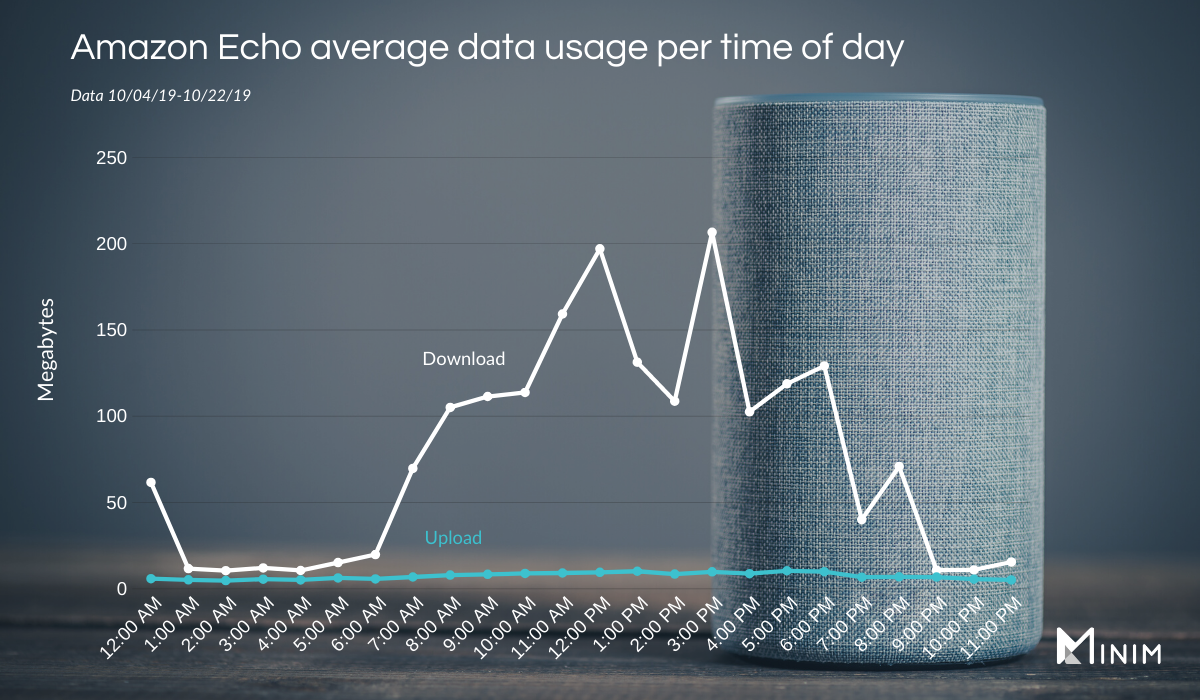
The Amazon Echo has pretty expected data patterns with downloaded data. The download data increases during waking hours, starting at 6 am as alarm clocks and podcasts project, peaking from 3:00 to 4:00 pm at 216 MB downloaded, and quieting down at 9 pm as people get ready for bed.
Now, let's focus in on upload data. Yes, Amazon Echo devices are constantly uploading data to the cloud. As shown below, the minimum average upload data usage point was 4.71 MB at 2 am (so 2:00 -3:00 am).
As a benchmark, I reviewed my Amazon Echo recordings and downloaded my frequent command, "Alexa, play Pandora" as a .wav file. The .wav file is 49 KB in size. That means that at its lowest usage hour from 2:00 - 3:00 am, Alexa is uploading 96 times the amount of data as my 3-second command.
Of course the burning question is, is Alexa listening in when I'm not speaking to her, or could this be some other device telemetry that the Amazon Echo is consistently uploading? While I won't give a definitive answer for that in this blog, I will provide a few data points.

Above, you'll see the recording I mentioned as it appears in the Amazon management interface, timestamped at 3:20 pm on November 1, 2019. I checked the Echo Dot's data usage at exactly that time using my Minim app. It had a noticeable characteristic: For a moment, the upload bandwidth (119 bps) jumped above the download (81 bps). What followed was an expected increase in download bandwidth as Alexa responded that she would play 90s alternative radio from Pandora and dutifully did just that.
Next, I used the Minim app to scroll forward to the following morning, November 2nd at 5:00 am, while I was sound asleep and not by my Office Echo. At that time, I saw a similar increase in upload bandwidth (144 bps) over download (120 bps), and quite close to the bandwidth numbers at the time of my voice command. I was able to find several examples of this upload bandwidth jump.
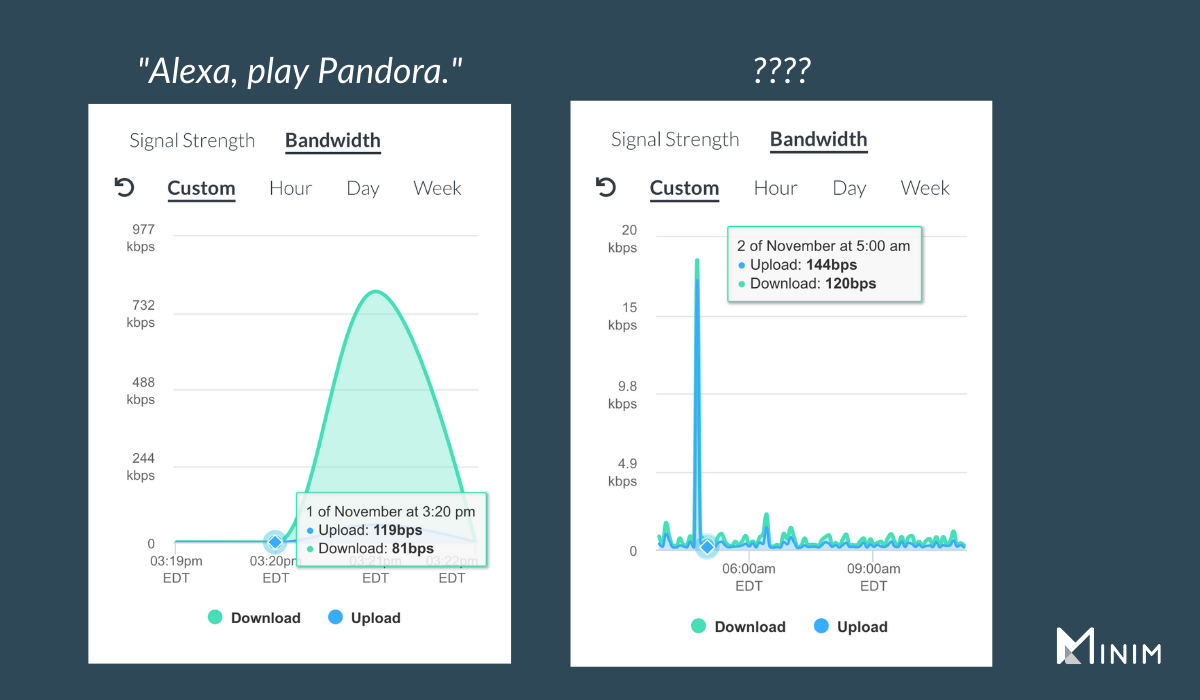
In summary, my Amazon Echo uploaded to the cloud a similar amount of data both when I gave a command and when I was sleeping, but it's difficult to know whether Alexa was listening in both times without further data and ML-driven analysis. That's for another blog— So if you're interested in learning more about Alexa-enabled device patterns, subscribe to our newsletter.
Chromecast data usage
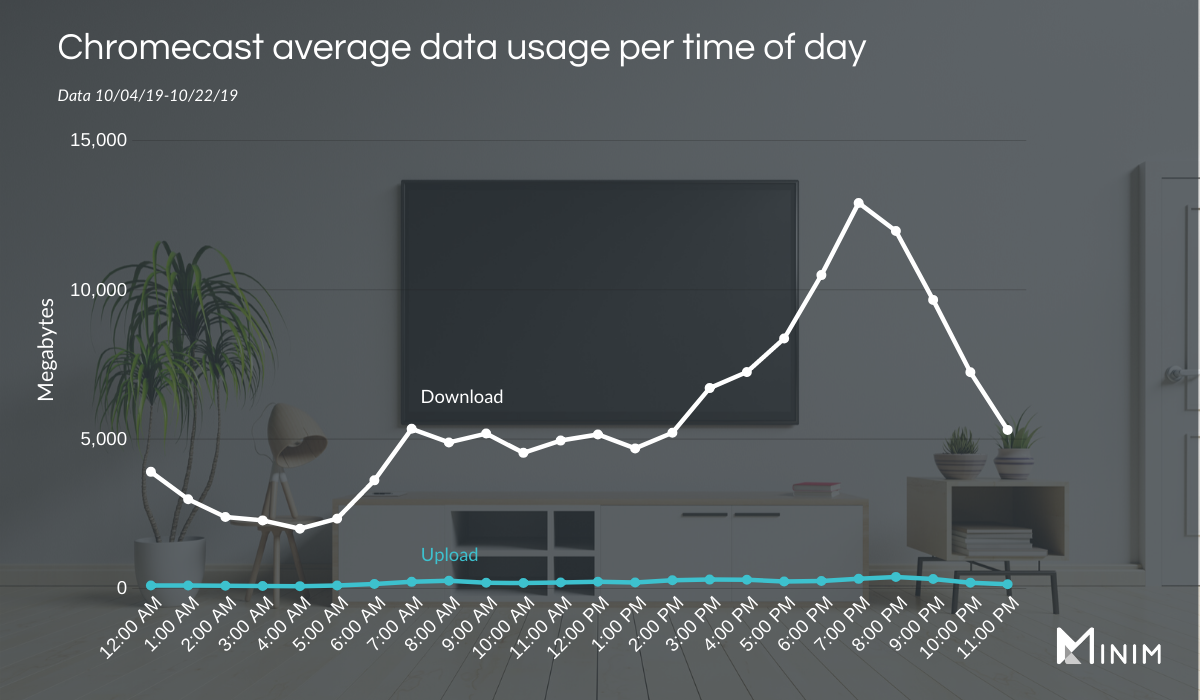
As with the Xbox One, Chromecast data usage appears to align with device usage patterns. Each mimic a device owner's typical work day pattern with download data peaks during the evening (12,909 MB from 7:00 to 8:00 pm) and dips when they are presumably sleeping (2,001 MB at 4 am).
The Chromecast gives us a good reason to mention yet another layer of anomaly detection: device interplay in the home. Earlier this year, accounts of Chromecast hacks were shared, detailing how a compromised Chromecast was used to stream Amazon Echo commands on the TV, like:
"Alexa, order an iPad,” or, “Alexa, turn off the house alarm,” or, “Alexa, set an alarm every day at 3am.”
The excess usage of these smart speakers could be picked up in data consumption anomaly detection.
iPhone X data usage
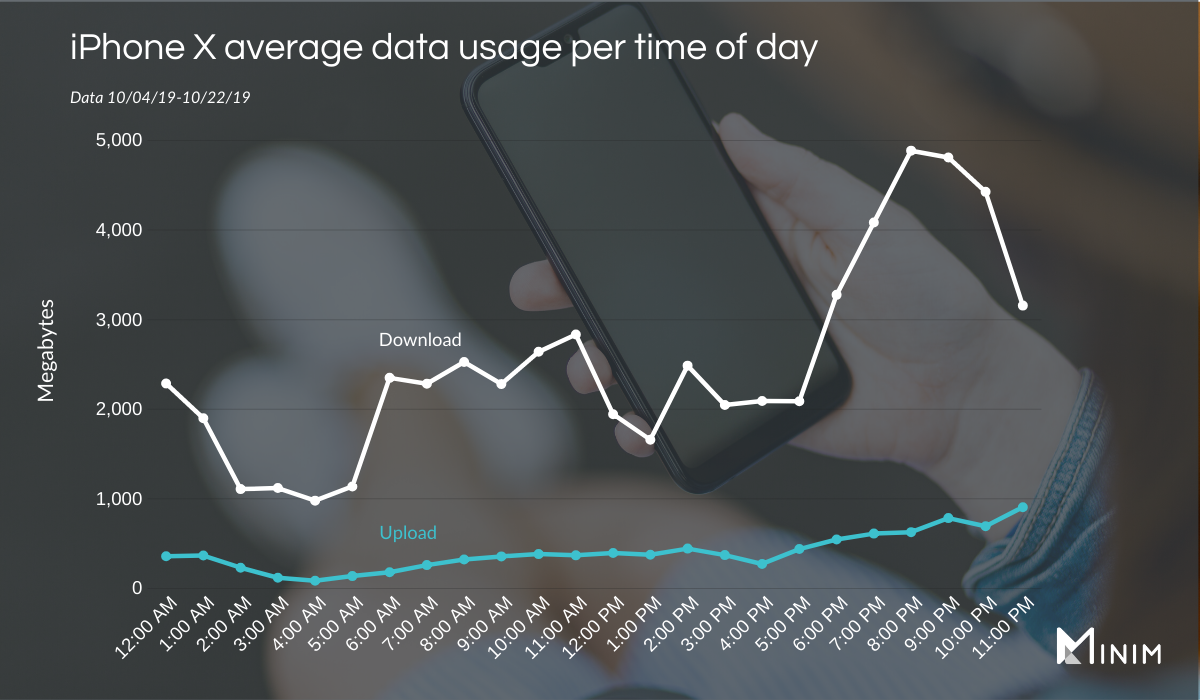
Average data usage per time of day for the iPhone X follows a similar data download pattern as that of the Chromecast and Xbox One, underscoring just how much our phones act as entertainment devices. It also made me wonder just how many folks are both watching their Chromecast and fiddling with their iPhone at 7 pm.
The iPhone X's average upload data was 402 MB per hour with an average download at 2,517 MB per hour. Notably, during our analysis timeframe, the iOS 13.1.13 software update was released on October 15th, which likely inflated the evening download averages by a bit.
Data usage by top domains
While data usage per day and time of day certainly give insight into device behaviors, another area we monitor closely is with whom the device communicates, and how much. To illustrate this, we've plotted data usage by domain for the Chromecast below.
.png?width=1024&name=Untitled%20presentation%20(2).png)
The distribution was similar for all six devices— Each device exchanged the majority of its data with 15-20 domains. Some of the top domains for each device are listed below:
- Xbox One: Netflix, Xbox Live, Hulu
- Philips Hue: Philips Hue, Amazon Services
- Nest Camera: DropCam Video Services
- iPhone X: Apple Services, Instagram, Facebook
- Chromecast: Netflix, Hulu, Google Shared Files
- Amazon Echo: CBS News, Amazon CDN, Amazon Telemetry, YouTube
With this data in tow, we can identify when a device starts talking to something it shouldn't be. In fact, if a device suddenly starts communicating with a suspicious domain, or consuming a lot of data from a domain that's out of its signature "contact list," Minim will immediately block that communication. Remember our CEO's connected yard sprinkler?
Like this blog? Become a Minim insider.